Trump’s 2025 Tariff Myth: The Flawed Math Behind Liberation Day
Meta Description: Trump’s 2025 tariffs revived the tariff myth. We break down the flawed math behind the China example and what it means for U.S. trade policy.
🔍 Introduction
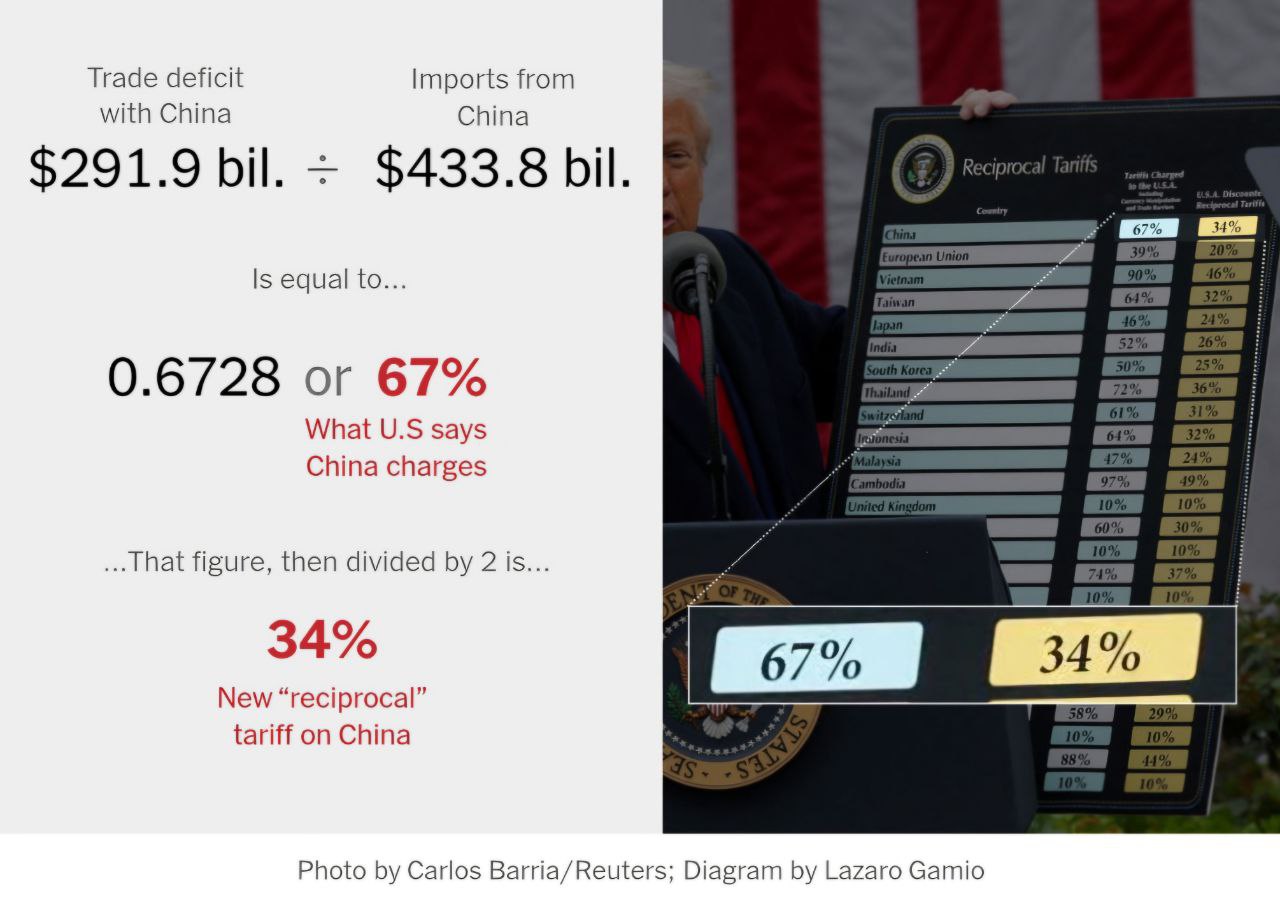
During Trump’s April 2025 “Liberation Day” announcement, the administration unveiled sweeping new tariffs — including a 34% tariff on Chinese goods. The justification? A widely cited tariff myth based on dividing the U.S. trade deficit with China by total imports, then halving it.
This article breaks down why that math is misleading and what the 2025 tariff hikes could mean for the U.S. economy and global trade.
📊 What Is the Trump 2025 Tariff Myth?
A prominent example used by the Trump administration was the case of China. By dividing the U.S. trade deficit with China by total imports, they arrived at a figure close to 67%. Then, they arbitrarily halved it to justify a 34% “reciprocal tariff.”
This approach has no basis in standard trade economics. It treats a trade deficit — which is a measure of economic flow — as though it were a tariff rate, which is a government-imposed tax. That’s a fundamental misunderstanding of how trade policy works.
See the original New York Times report covering this tariff math in more detail.
⚖️ Trade Deficits vs. Tariffs: A Crucial Distinction
Let’s clear it up:
-
A trade deficit means the U.S. imports more from a country than it exports to it. It’s a measurement — not a penalty or a fee.
-
A tariff is a tax on imports, typically a percentage of the good’s price, applied at the border.
Equating the trade deficit to a tariff rate is like saying your grocery bill is a tax from the supermarket. It’s not — it just means you bought more than you sold.
For more on trade mechanics, check the World Trade Organization’s explanation of tariffs.
📅 Trump’s 2025 Tariff Plan: What Was Announced?
On April 2, 2025, Trump introduced a two-tier plan:
-
A baseline 10% tariff on all imports, effective April 5, 2025.
-
“Reciprocal” tariffs on countries with major trade surpluses against the U.S., including:
-
China: 34%
-
Vietnam: 46%
-
Cambodia: 49%
-
You can read the full policy summary on the White House website.
📉 Why the Math Doesn’t Add Up
The 67% figure comes from:
$291.9B (U.S. trade deficit with China) ÷ $433.8B (total imports from China) = 67%
Then it’s simply halved to propose a 34% “reciprocal tariff.”
This isn’t how tariffs are set. It ignores actual applied tariff rates — which, pre-trade war, averaged around 7–10% for China and 3–4% for the U.S., according to WTO data.
It also ignores non-tariff barriers, currency effects, and global supply chains — all essential elements in real trade strategy. See Brookings Institution’s overview for a deeper dive.
🌍 Broader Impacts of Tariff Myths
Basing trade policy on this kind of math can have serious consequences:
-
Rising costs for American consumers and businesses
-
Global retaliation, as countries hit by tariffs strike back
-
Investor uncertainty, leading to economic volatility
For a broader look at how geopolitical shifts impact long-term planning, see our analysis on hedging geography in MENA investment strategy.
🧠 Final Thoughts
The Trump 2025 tariff myth, particularly the 67% figure used in the China example, shows how political narratives can distort economic realities. Trade policy should be based on facts, not fuzzy math.
Understanding the difference between trade flows and tariff instruments is critical if we’re going to build smarter, more sustainable economic strategies — not just in the U.S., but globally.


